Solar Section        


January 31, 2021

Ramp Up of Solar Activity Cycle 25

By Theo Ramakers

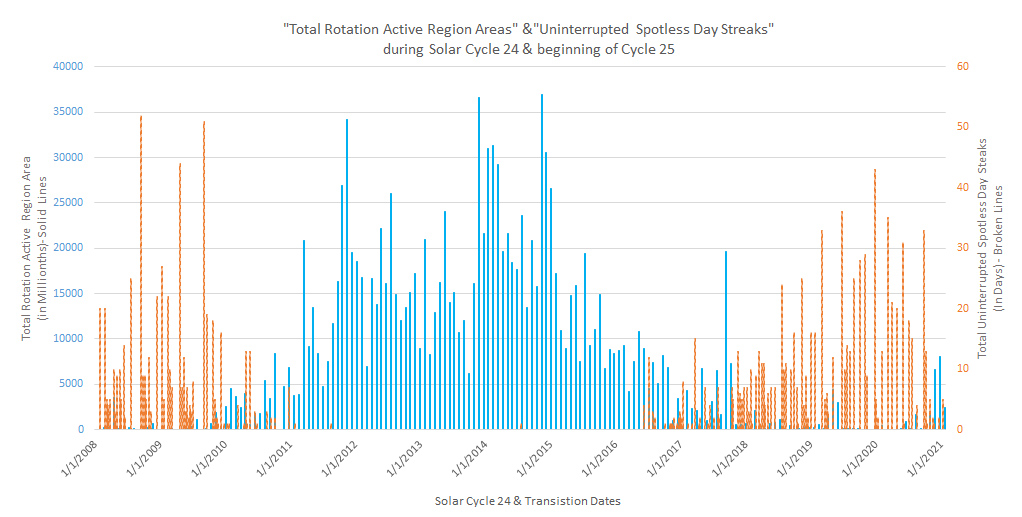
I was asked if it was true that it seemed that Cycle 25 activity ramped up faster than previous rotations.  In order to try to shed some light into this, I am providing two graphs. It is noted here that each graph, while created by me, is based on data provided in the daily GEOalert notifications from NOAA’s Spaceweather Prediction Center (SWPC).  Each graph shows the value of the sum of all daily active region areas for a  Rotation  since January 1, 2008 (Blue lines, mostly in the middle, with their scale on the left).  Also shown is the number of spotless days.  (red lines at the side with the scale on the right). The difference between the two graphs is that one of them shows the number of consecutive spotless days at the end of this spotless period (Streak).
The second graph below shows the number of spotless days by ROTATION at the last day of the rotation  The number of these days reported by the size of the bars in this graph, don’t have to be consecutive, but the reported value is shown for an equal time period  for all (one rotation).  The Minimum for Cycle 23/24 (Beginning of Cycle 24) was in December of 2008.  The Minimum for Cycle 24/25 (Beginning of Cycle 25) was during December of 2019, giving a cycle duration of 11 years. It is clearly seen that the blue lines (indicating Solar Activity) don’t start showing in 2009, one year following the minimum , but this cannot be said for 2020, a year after the next minimum.  We surely see noticeable activity during the end of 2020. In addition, the Total Active Region Areas by Rotation show a higher value now than during the beginning of the previous solar minimum.  In fact the Total Active Region Area by Rotation did not exceed 5000 millionths until August 9, 2010, or 20 months after the previous minimum.  For the current Cycle, November 27, 2020 marks the first time where the 5000 millionths barrier was broken, and by well over 1000 millionths, which is only 11 months.  So to summarize the results so far, Cycle 25 seems to gain in activity much faster than Cycle 24 did.  We are eager to learn if this fast ramp up will continue.


January 16, 2021

Brief Summary of CR 2238

By Kim Hay
ALPO Solar Assistant Coordinator

CR2238 started on 2020-11-28 at 14:44 UT (Julian Date 2459182.11500 or Year 2020.91339) and ended some 27 days later on 2020-12-25 at 22:30 UT. This cycle saw a total of 13 Active Region (AR) sunspot groups AR2783 through AR2795.

Carrington Sunspot Data for CR2238
Data from SILSO

Carrington Rotation 2238 continued with high activity from AR2783 and AR2785-86 which originated with the prior rotation. By November 29th a new group in the Northern Hemisphere, AR2787, showed up. This was the only Northern Hemisphere group for the CR2238 cycle. It has been noted by Solar physicists that the two hemispheres are not always in sync. Images from the Solar Dynamics Observatory (SDO) on December 4th demonstrated this imbalance, especially in the H-alpha light. It could take up to two years for the Northern Hemisphere to catch up, but this is just part of a normal Sunspot Cycle.
Also on November 29th, the far side of the Sun produced the largest Solar flare seen in three years with an M4.4 flare, producing a shortwave radio blackout over the Antarctic. The group responsible for the outburst, AR2790, rotated into view on December 2nd. At this point in the cycle AR2786 was showing light bridges and decay.
There were several flares throughout CR2238 ranging from A to G1 activity. The flare from AR2790 produced much media attention for possible aurora activity but it fizzled out, producing aurora only in the higher latitudes. 2020-12-14-1551-GlhGrsm-CaK.jpgA new sunspot group on December 12th, AR2792, emerged in the Southern Hemisphere exhibiting Bxo/Beta and producing a C4 class flare.
December 4th, 2020 had a total Solar Eclipse in South America. One of our observers, Guilherme Grassmann from Brazil, obtained an image of the eclipse in Calcium light.
AR2793 emerged on December 15th, but a few days later during December 19-20 the Sun was void of sunspots. That was short lived, however, as new sunspot activity arrived on December 21stin the form of AR2794, followed by AR2795 showing up on Christmas Day. This closed out the Carrington Rotation with stable sunspots and groups with no chance of aurora activity.
Thanks to the contributors who forwarded their sketches and images for inclusion in the ALPO Solar Image Gallery for AR2238:
  • Paul Andrew
  • Anthony Broxton
  • Vlamir da Silva Junior
  • Howard Eskildsen
  • Guilherme Grassmann
  • Monty Leventhal
  • Frank Melillo
  • John O’Neal
  • Theo Ramakers
  • Randy Tatum
  • David Teske
  • Geert Vandenbulcke

solar-section-logo2.jpg

We invite you to join the A.L.P.O. Solar email list to keep
current with all the Solar activity and the efforts of your fellow observers.

   Powered by WordPress     Personalized by: Larry Owens     Contact the Webmaster