Chapter 3 -- THE POLAR REGIONS OF MARS
The brilliant white polar caps of Mars are among the planet’s most prominent and intriguing features. Because the Martian polar caps are affected by the planet’s 25.2° axial tilt, they are observed to thaw and re-accumulate in an annual seasonal cycle. Indeed, many of the observed surface changes and atmospheric phenomena appear to be directly coupled to the seasonal climate which causes the spring thawing phase of one polar cap as autumn allows the reformation phase of the opposite cap.
Planetary scientists have shown the white substance of the Martian polar caps is probably some form of crystallized water (H2O) or solidified volcanic carbon dioxide (CO 2 ). Space mission data sent back from Mars confirmed Earth-based observations of frozen water and carbon dioxide in the Martian polar caps. Sublimation of the H2O and CO2contributes to the Martian atmospheric clouds and hazes as the spring and summer cap-thaw becomes more rapid.
As the Martian South Pole emerges from the darkness of winter at the time of southern Spring Equinox, the dull-gray polar hood begins to retreat pole-ward and revealing the brilliant white edge of the cap ( SPC ). Once free from the polar hood and exposed to direct sunlight, it sublimates rapidly, shines brilliantly, and undergoes spectacular changes during the rapid phase of spring thaw.
Many interesting cloud or ice-fog formations appear at the polar regions of Mars during late spring as the sub-solar point rises higher in the Martian latitudes. Since the atmospheric pressure is usually below the point that water can become liquid and temperatures are usually below the freezing point, especially in the polar regions, melting of the polar ice is not possible. The sublimation process is responsible for the water vapors we find in the Martian atmosphere that forms hazes and clouds (See WHITE AREAS: METEOROLOGY? discussed in Chapter 5).
Both polar regions exhibit similar behavior during their respective early-spring periods. Often, each emerges from its winter darkness when its dull-gray hood begins to dissipate as spring progresses, then its brilliant polar cap peeks out and begins to retreat pole-ward. This is especially true for the Northern Polar Region ( NPR ), however, observers have noted that occasionally when the Southern Polar Region ( SPR ) reaches the end of its respective winter season it is often clear of its dull cloud/haze canopy. This has led astronomers to considerable debate over the SPR’s seasonal behavior.
There is considerable difference in the north and south polar caps of Mars caused by the asymmetry in Martian seasons. The south cap is formed during the long, 382 (terrestrial) days of southern fall and winter when Mars is near aphelion, and it covers more than 70 areocentric degrees at greatest extent (extending below latitude 55º). The north cap is formed during the short, warmer 305 (terrestrial) days of northern fall and winter when Mars is near perihelion, and it usually measures only about 53º at maximum extent ( Slipher , 1962) ( Michaux , 1972).
NORTH POLAR REGION
The dark banding, the so-called "Lowell Bands," that can often be seen surrounding the polar caps during retreat is thought to be caused by formations of hoarfrost at the edge of the polar cap. This rough or textured material lowers the reflection of Sunlight from that area of the surface and could possibly darken the surface adjacent to the polar cap. Any suggestion that damp, melted water ice from the polar cap causes this phenomenon is unfounded. In addition, from the perspective of Earth-bound observers the brilliant reflection from the polar cap next to a darker surface material will cause a "contrast effect," as we observers refer to it. When very bright objects are placed next to duller, material we tend to see a band separating the two darker than it really is. Irradiation in the human eye is another cause for this phenomenon (See Figure 3-1).
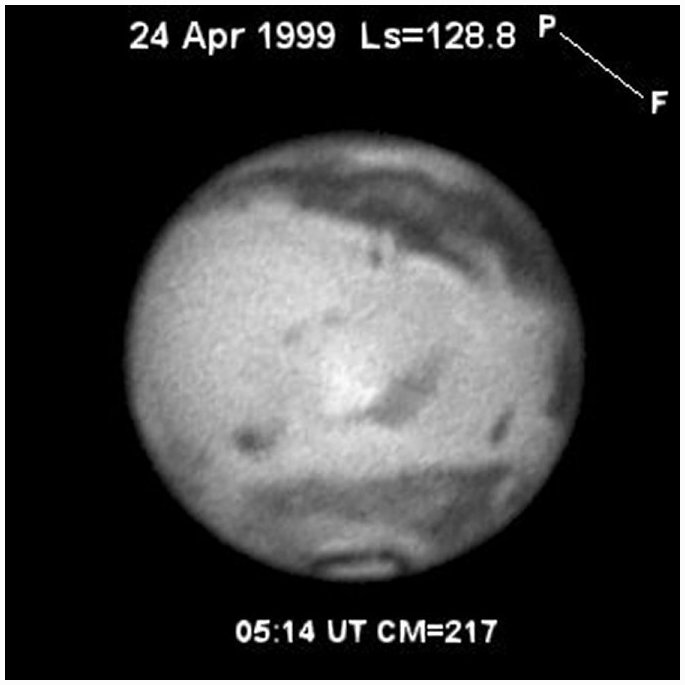
Figure 3-1. CCD image of Mars during northern summer with NPC remnants or projections Lemuria (196° -227° long.) and Cecropia (278° -311° long.). CCD image by Don Parker using 41-cm Newtonian.
In the recent past,
planetary astronomers had suggested that the NPC exhibits
little or no variation in its rate of thaw or in the size of
its summer cap remnant from one apparition to another [
Fishbacher et al ,
1969]. In several independent studies, Donald C. Parker,
Jeffrey D. Beish and the late Charles F. Capen have performed
numerous filar-micrometer measurements of the retreating NPC
which lead to some very interesting results concerning its
behavior. We were surprised to find that the 1980 summer cap
remnant (which is composed largely of water ice under a thin
layer of frozen CO 2 ) was
significantly smaller than it had been during the Aphelic
apparitions of the 1960’s and smaller than "normal"
by nearly 2 degrees of areocentric latitude [ Parker et al , 1983]. Note that
the "normal" polar cap has been calculated by
averaging polar cap measurements from the 1882, 1883, 1884,
1886, 1888, 1899, 1901, 1903, 1960, 1962, 1964, 1966, and 1969
Aphelic apparitions.
When similar apparitions are compared, during which the NPC was measured with identical equipment, the 1980 cap’s edge retreated at a faster rate and by early summer, was located at 4 to 6 degrees areocentric latitude higher than the NPC remnants of the 1960’s. Subsequently, measurements of the NPC over the next two Aphelic apparitions rendered nearly the same results during 1981-82 and, to a lesser extent, during 1983-84. The rate of regression during 1981-82 fell short of the 1979-80 rates and followed a more "normal" regression during 1983-84. Nevertheless, the trend line indicated that the NPC retreated more rapidly, even during 1983-84, and its summer cap remnant remained smaller than at any time during the 1960’s.
The Martian Arctic, therefore, seemed to have warmed since the 1960’s. Further evidence supporting this theory was the reappearance of a rift in the NPC that seems to only appear when the cap is smaller than "normal". This rift is called the "Rima Tenuis" and was rediscovered by ALPO’s International Mars Patrol (IMP) astronomers in 1979 by visual as well as photographic observations. The Rima Tenuis was discovered in 1888 by G. Schiaparelli and was observed during 1901, 1903, and 1918. It was not observed again until 1979 (more than 60 years later) despite intensive searches by spacecraft and large terrestrial telescopes.
The 1982 regression rate closely paralleled that of 1980, but in 1984, a number of unusual events were observed. After a relatively normal initial thaw, the cap abruptly stopped receding during late Martian spring (70° Ls) and began to re-condense [ Parker et al, 1984]. This is not abnormal and often occurs when Mars is near aphelion. The phenomenon has been termed the " Aphelic Chill " by Professor Clyde Tombaugh and seems to be caused by arctic hazes blocking the feeble sunlight before it can reach the cap. A strong Aphelic Chill was observed during 1982.
What was unusual in 1984, however, was that the NPC remained large for an abnormally long period of time and actually showed signs of re-condensation on three occasions (Martian northern spring) until it resumed a more rapid regression in early Martian summer. The delay in cap recession lasted approximately one Martian month (30° Ls), during which at least five dust storms occurred on Mars [ Beish et al , 1984].
It is likely that the abnormal amount of dust in the Martian equatorial region’s atmosphere absorbed enough heat to delay the North Cap retreat. A dense layer of dust and haze also covered the NPC during this time, which may have blocked off sunlight from the pole and the retreat slowed. Also, it is quite possible that the dust in the polar atmosphere provided the necessary nucleus for condensation and in turn may have produced "snowfall." Most likely, the dust-laden condensates just settled to the surface to form a frost layer, which added to the overall surface area of the cap. This mechanism has been suggested by observations made by the Viking spacecraft in the 1970’s [ James, 1979].
One other interesting result emerged from the 1984 apparition -- the appearance of the water-ice orographic clouds forming over the Tharsis volcanoes were delayed nearly one Martian month, corresponding to the delay in NPC recession. A.L.P.O.’s Martian Meteorological Survey ( discussed in Chapter 5 ) had revealed that the time of appearance of the northern summer orographic clouds is highly predictable, so their tardiness in 1984 is significant. We feel that these observations have, for the first time, demonstrated a direct link between NPC recession and orographic cloud formation.
Further support to the evidence of arctic warming was, as mentioned previously, the increase in the numbers of blue and white clouds. This increase persisted into the 1982 and early 1984 apparitions during which the NPC again exhibited a significantly smaller than normal remnant. One may conjecture that the mechanism responsible for the apparent warming on Mars was a contributing factor in producing the high number of dust storms during the 1983-85 apparitions.
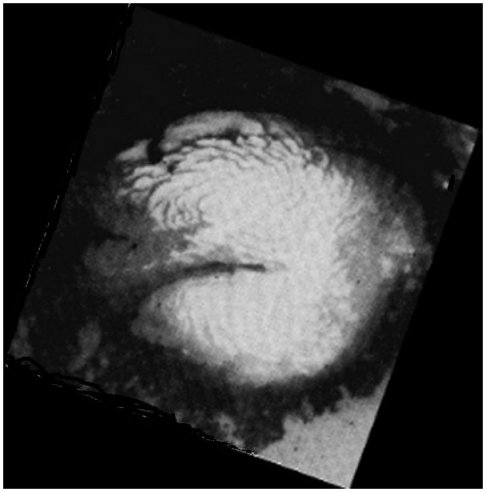
Figure 3-2.Viking Orbiter image of Mars’ North Polar Cap area during early northern summer. Notice the large rift, Rima Borealis, from left to right crossing to near center of the cap. The summer "projections" are beginning to emerge from the edge of the polar cap. NASA Viking Spacecraft Image. 0 degrees longitude facing down.
Popular literature and papers published in The Strolling Astronomer, (J.A.L.P.O.) on Mars’ polar regions usually mention the dense polar canopy or "hood" that appears in late northern winter and early spring. However, past astronomers Clyde Tombaugh (discoverer of Pluto) and Leonard Martin (Lowell) discussed the possibility that the north polar cap does not form on the surface until the polar hood begins to dissipate [ Martin et al, 1984]. We know that the polar cap we see in summer is a layer of water-ice and we refer to this cap region as the "summer remnant." The latitude of the southern edge of the summer remnant or water ice cap is usually around 79 degrees by mid-summer.
The 1982 regression rate closely paralleled that of 1980, but in 1984, a number of unusual events were observed. After a relatively normal initial thaw, the cap abruptly stopped receding during late Martian spring (70° Ls) and began to re-condense [ Capen et al, 1971 and Parker et al, 1984]. This is not abnormal and often occurs when Mars is near aphelion. The phenomenon has been termed the "Aphelic Chill" by Professor Clyde Tombaugh and seems to be caused by arctic hazes blocking the feeble sunlight before it can reach the cap [ Parker et al, 1983].
The A.L.P.O. Mars Section gave passing thought to this hypothesis and decided to attempt to watch for any sighs of this beginning in early 1992. By then Mars Section Recorder Don Parker was well on his way to perfecting his CCD imaging techniques when he slipped up once and forgot to install a special Infrared Radiation blocking filter in his optical train and took some remarkable images of Mars.
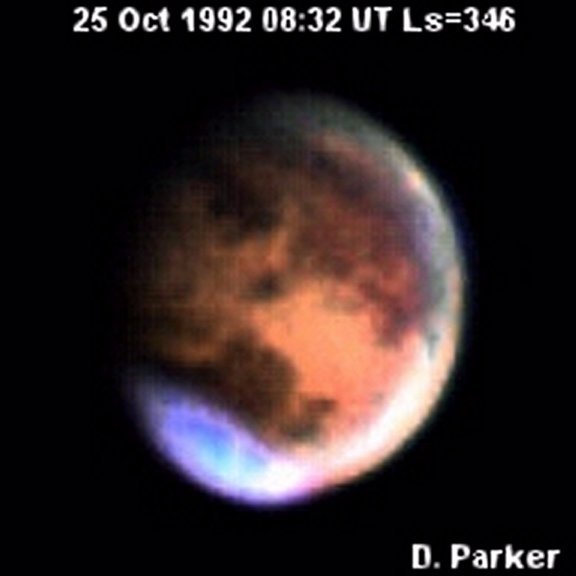
In the 1992 apparition of Mars, observers reported that the North Polar Hood (NPH) was bright and large for most of this apparition until late November 1992 (2° Ls). At that time, we started to see the NPH slowly break up. When the NPC appeared it was brilliant and mostly clear afterward with a very dark collar around it. The NPC appeared, at times, to be "peanut" shaped with notches in the collar. As the NPH started to thin out in December, we got views of some of Mars’ far northern dark marking.
However, when we looked at the images Parker had taken on October 25, 1992 (346° Ls) we noticed dark markings mixed in with the bright polar hood. After some years now and hours processing these images, we have discovered that the dark markings correspond with well-charted surface albedo features the images regions of Mars. While it is only speculation we feel that theses markings are real surface features that has leaked through on the tri-color CCD images the polar hood and may be evidence that surface deposits of ice or frost actually does not exit during that seasonal period. The period corresponds to the well observed "polar hood" phenomena and if true adds credibility to the Tombaugh-Martin theory.
The Martian polar hoods are bright and often even as bright as the polar cap itself. In order to determine whether it is the polar cap or polar hood cloud try comparing the view through a red filter (W23A or W25) or a green filter (W58) vs. blue filter (W80A). If the feature disappears in either the red or green filter it is a polar hood cloud. During the 2005 opposition of Mars the North Polar Hood had a prominent blue color to it [ Jamison , 2007].Figure 3-3. CCD image of Mars during late northern winter indicating presence of polar hood and surface albedo features leaking through the green and blue filters. CCD image by Don Parker using 41-cm Newtonian. South edge of polar hood 49.5° latitude and northern albedo area 69.7° latitude.
Prior to the use of CCD technology we relied on either visual observations or film images of the polar regions and even using deep red filter we were unable to see though the hood to see the polar cap surface materials. Now, using infrared sensitivity of cameras with CCD chips we are now able to penetrate through the haze canopy, the polar hood, and see the actual polar cap.
A recent article on the 2007 NPC (pages 29 - 36, PDF file) reveals an important analysis on the detection of the north polar cap [ Venable , 2008].
As the polar region is exposed to more and more sunlight, erratic behavior is often detected in the cap regression and clouds and/or hazes are often observed. Cloud "fronts" or waves are frequently seen slowly moving away from the polar regions to expand and form planetary cloud systems which give the planetary meteorologist considerable information for forecasting Martian weather.
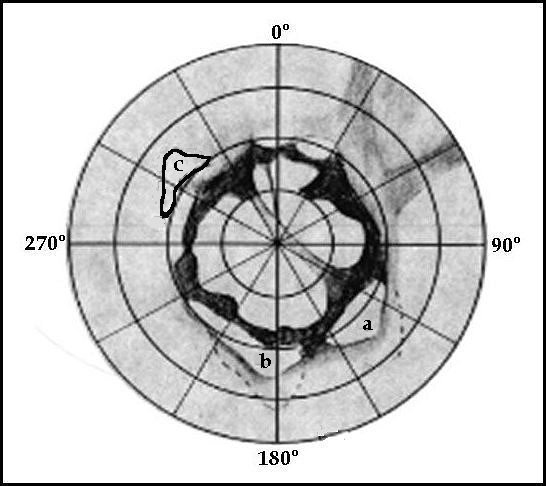
Figure 3-4. Drawing of Mars’ North Polar Cap area during early northern summer. Notice the dark rift, Rima Tenuis crossing the cap from 140° – 330° longitudes. The summer "projections" or remnants are beginning to emerge from the edge of the polar cap. Projection (a) Ierne, (b) Lemuria, and (c) Cecropia. Drawn by Jeff Beish.
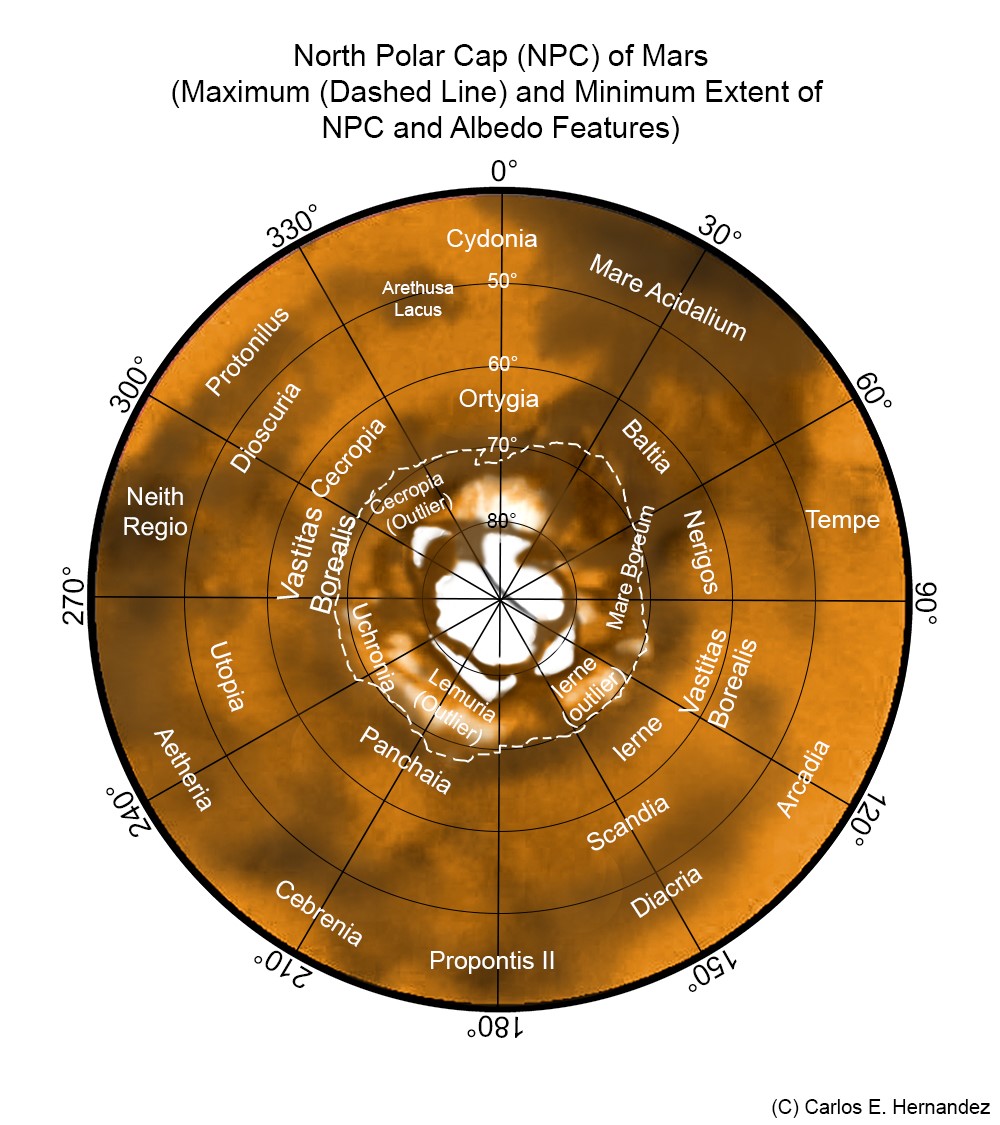
Figure 3-4a. Detailed drawing of Mars' North Polar Cap area during early northern summer. Notice the summer "projections" or remnants "Ierne, Lemuria, and Cecropia" have emerged from the edge of the polar cap. Drawn by Carlos Hernandez.
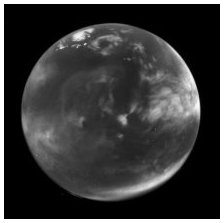
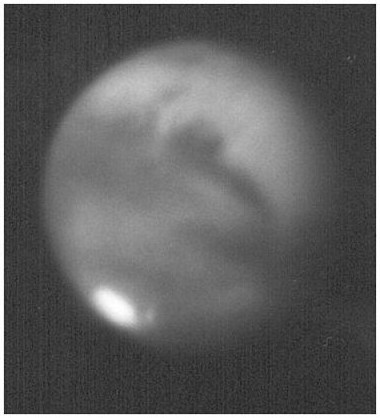
Figure 3-5.Violet image of Mars taken by the Hubble Space Telescope (HST) during late northern summer. This image shows several cloud formations on the evening limb and a low-pressure cloudy mass that has moved south and east from the north polar region. NASA HST image.
A study of the history of the Martian NPC
from measurements made from 1882 through 1903, 1962 through
1969, 1970 through 1978 ,and 1980 through 1984 reveals that the
NPC appears to have been larger than average during the 1960’s
and then slightly smaller than average during the present
decade. This paper shows that at least the 1960’s NPC was
larger, on the average, than the NPC during the 1980’s [
Parker et al ,
1983]. This study of the NPC is still in progress using
the three volumes of the Annals of Lowell
Observatory: 1894 , various Lowell
Observatory Bulletins with NPC measurements during the 1901
– 1905 apparitions of Mars, and many other sources meticulously
collected and archived by Chick Capen. Measurement before
1962 were taken from drawings and were not included in the
statistical averaging used for the plot in Figure 3-6.
The results will be added herein in good time.
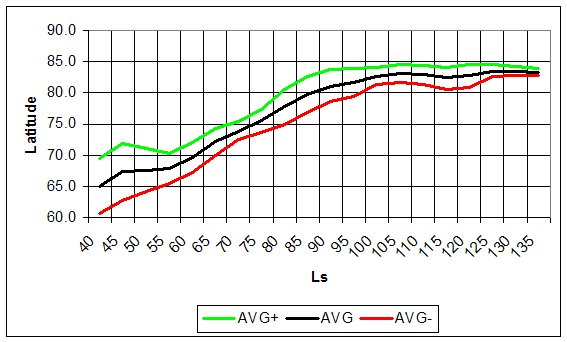
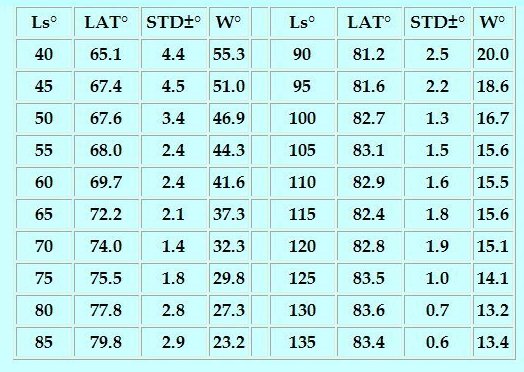
The Martian North Polar Cap (NPC) spring and summer regression curves have been average from latitude measurements taken during apparitions from 1980 ( Capen,Parker & Beish ), 1982 ( Parker & Beish ), 1984 ( Parker & Beish ), 1993 ( Parker & Beish ), 1997 ( Parker & Beish ), 1999 ( Parker & Beish ) and 2003 ( Parker & Beish ). The resulting average north polar cap latitudes with respect to the Ls are presented in Table 3-1. The Areographic latitude of the eastern and western edges of the NPC are given as the vertical scale of each graph and the Areographic longitude of the Sun (Ls) appears at the bottom of each graph for the indicated seasonal periods observed.
Figure 3-6. Retreat of the North Polar Cap averaged from the 1980 through the 1999 apparitions of Mars. Green and red lines represent the standard deviation from the average. Ls is the longitude of the Sun. The curves represent the average latitudes for each 5 degrees in Ls.
The following represents the north polar cap
measurements during the apparitions: 1901 (Antoniadi),
1903 (Antoniadi), 1962 ( Capen ), 1964 (
Capen ), 1966 ( Capen ),
1969 ( Capen & Cave
), 1980 ( Capen , Parker
& Beish ), 1982 ( Parker & Beish
), 1984 ( Parker & Beish ), 1993 (
Parker & Beish ), 1997 ( Parker & Beish ) and 1999 ( Parker
& Beish ).
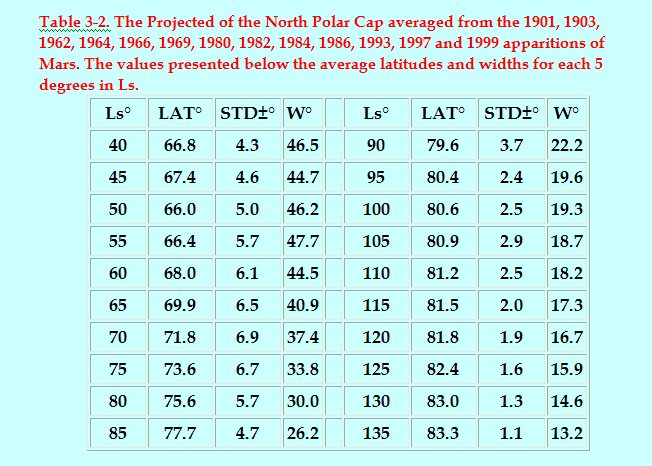
From the plot and table below one can see a substantial difference between the results Figure 3-6 and Table 3-1 and these in Figure 3-7 and Table 3-2, especially the Standard Deviations (STD). From the historical records we find that substantial differences may result from the systematic errors associated with the type equipment and the individual observers used in the measurements. It is not clear that these differences are as result of natural processes or observer errors; so we will only use these measurements as a reference and are not to be used to predict the behavior of the north polar cap of Mars as presented in this paper.
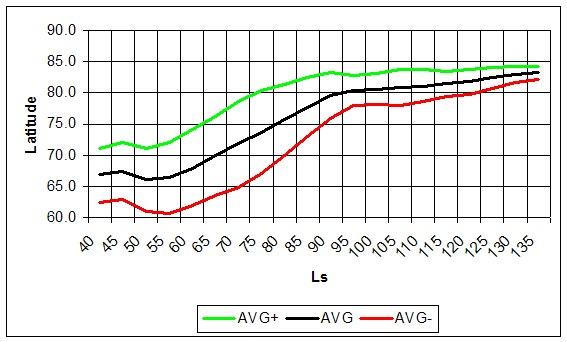
Figure 3-7. Retreat of the North Polar Cap averaged from the 1901, 1903, 1962, 1964, 1966, 1969, 1980, 1982, 1984, 1986, 1993, 1997 and 1999 apparitions of Mars. Green and red lines represent the standard deviation from the average. Ls is the longitude of the Sun. The curves represent the average latitudes for each degree in Ls.
Peripheral Aspects
Upon emergence from beneath the polar hood, the NPC appears to have a rather smooth and uniform border. Later, during the rapid thaw period, the edge of the cap will appear uneven. C.F. Capen, using the 82-inch reflector at the McDonald Observatory in Texas, wrote "observing with the large telescope with high resolution revealed a polar cap with an uneven and jagged edge with numerous small, white, circular detachments along the dark peripheral band as the cap rapidly retreated poleward during Martian spring." By Martian summer, the NPC retreat slows and three bright projections appear on the edge of the cap. These areas detach from the NPC as the cap retreats past the 80° latitude and remain throughout the summer and autumn. The white remnants are named after the areas on Mars that they occupy.
These bright projections averaged
center-of-area Areographic longitude positions according to G.
de Mottini’s 1941-52 IAU Mars map are as follows: Ierne 137°,
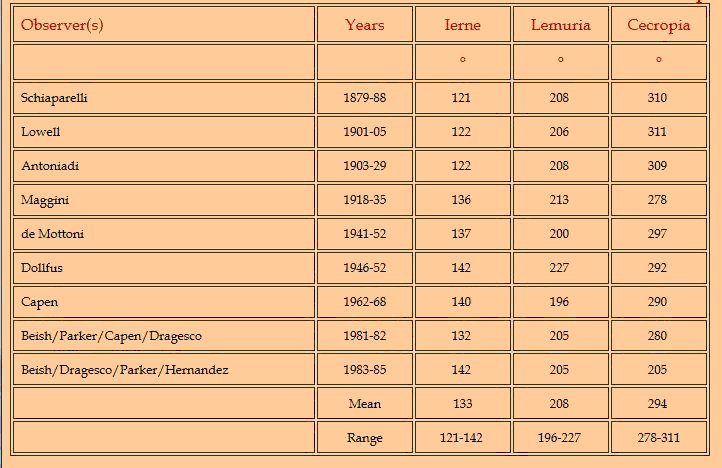
Lemuria (Olympia) 200° , and Cecropia 297°. Table 3-3 compares
these areas observed by various Mars observers from 1879 to
1984. (Refer to image in Table 3-3). Two other white patches
were observed that are not previously named as classical NPC
remnants. They were noted at the following aerographic
locations: 1) latitude +81° and longitude 3°, and 2) latitude
+82° and longitude 59°.
Table 3-3. NPC Residuals lists observers and dates the projections were observed.
Observing these remnants can be most challenging, even when using large telescopes. With high magnifications and apertures of 10 inches or more, these features usually become apparent soon after the Martian summer solstice (90° ). The authors regularly employ magnifications of 450x to 1000x for studying the Martian arctic.
THE RIMA TENUIS
G. Schiaparelli while using a 9-inch refractor in 1888 noted that the North Polar Cap of Mars was divided in two parts by a dark rift or fissure. This observation was soon confirmed by Terby and Perrotin. This rift, called Rima Tenuis, was observed many times from 1901 through 1918. Records from the British Astronomical Association (B.A.A.) indicate that the Rima Tenuis had been observed during 1933 and again in 1950.
C.F. Capen carried out a search for the Rima Tenuis during the 1960’s. Although large telescopes of 16, 30 and 82 inches in aperture were used, the search was unsuccessful. It was not until late 1979 that the Rima Tenuis appeared again. The first evidence of its return was observed by D. Troiani of Chicago, Illinois, who observed a dark notch at the south edge of the NPC near 335 degrees areographic longitude. Later Troiani saw the entire feature crossing the NPC.
R. Robotham, J. Dragesco, J. Beish and D. Parker observed the Rima Tenuis within days of the first observations of the notch. Later, on February 22, 1980, P. Moore and C.F. Capen observed the complete Rima Tenuis while using the Lowell’s 24-inch refractor [ Capen , 1980]. It became a regular feature during the 1980 apparition and again in 1982. Association of Lunar and Planetary Observers (ALPO) astronomers MacFarlane, Aerts, and Parker photographed the Rima Tenuis. However, due to the extremely low contrast and small size of this feature, we do not have a photograph good enough to publish as of yet.[ Beish et al , 1982]
Table 3-4. List of observers and dates the Rima Tenuis was first observed.
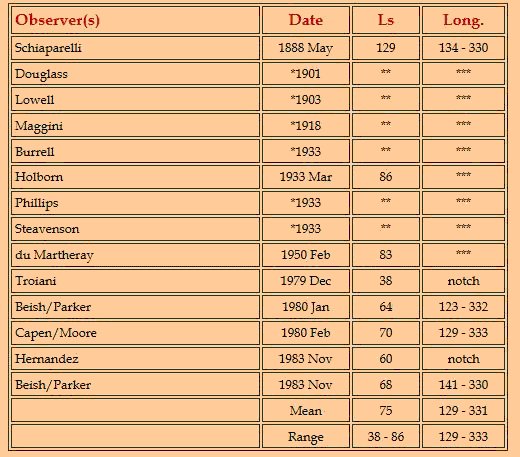
It would seem to me that by now space scientists would have recovered the phenomenon from spacecraft images. Also, the Hubble Space Telescope (HST) images should have revealed this feature if it should appear during periods when ground-based observers reported seeing it. To date no feature resembling the Rima Tenuis or any a rift or fissure has been recorded by HST or spacecraft in the location reported for this feature. This is not to say we should rule out the existence of rift like features; however, with the recent revelations from HST images showing several dust streaks crossing the cap we may have to begin rethinking our theories for the Rima Tenuis.
This author will reserve judgment on this until we recover images of a dust steak crossing the polar cap at the same longitudes as the Rima Tenuis has been consistently seen in the past. It is one thing to say something may exist; another thing to say it does not exist, especially when there have been so many visual observations of the Rima Tenuis and so few dust clouds seen crossing the polar cap.
We must remain open minded and remember that the Rima Tenuis was reported by competent observers in 1888 and again at the turn of the century, and then a few times during the 1930’s and 1950’s. After December 1979 many ALPO and BAA Mars observers recorded it for the next 5 or 6 years almost as a regular feature crossing the north polar cap at or near 130 to 330 degrees Areographic longitudes. This phenomenon cannot be disregarded and pooh-poohed as an illusion or figment of our imagination when so many observers saw it. Is it possible for dust streaks to cross the NPC at or very close to the same longitudes? Yes, as we have seen recently from HST, space craft and ground-based imaging. Rima Tenuis was not recorded for many years until 1979, and after 1986 not seen again for a number of years. Recently however, dust streaks have been imaged by HST, other space craft and ground-based telescopes to cross the NPC near the same longitudes as Rima Tenuis. This mystery has not been solved by any means.
As the Martian South Pole emerges from the darkness of winter at the time of southern Spring Equinox, the dull-gray polar hood begins to retreat pole-ward and revealing the brilliant white edge of the cap (SPC).
Once free from the polar hood and exposed to direct sunlight, it sublimates rapidly, shines brilliantly, and undergoes spectacular changes during the rapid phase of spring thaw. We have studied the retreating or shrinking of the Martian polar caps for hundreds of years, however, observations of the initial formation of the south polar cap (SPC) are rare [ Miyamoto , 1971].
Debate as to when the SPC forms has had little data to go on until the modern space craft began mapping the surface of the Red Planet on a daily basis. Some researchers suggested that the surface materials of the SPC form after the hood begins do dissipate on or about 176° Ls or right after the Vernal equinox (180° Ls) [ Miyamoto, 1972] [ Miyamoto , 1974]. ]. In the early 21st century, W. H. Pickering observed a forming south polar cap just before the southern vernal equinox [ Pickering, 1925].
For decades planetary scientists held the belief that the composition of the SPC was mainly Carbon Dioxide (CO2) ice with traces of water (H2O) ice. Recent studies by Caltech planetary science professor Andy Ingersoll and his graduate student, Shane Byrne, concluded that the decades-old model of Mars’ polar caps being made of dry ice (frozen carbon dioxide) is in error [ Ingersoll et al, 2003] [ Rayl , 2003] [ Titus et al , 2003].
During Perihelic apparitions the prominent south polar cap may be studied and measured to watch the edge of the cap retreat southward during late spring and summer, and in some cases see it reform during the late autumn or early winter. The South Polar Region (SPR) will tilt towards the Earth during these close apparitions and will remain so for a long time period. Some Mars apparitions that we refer to as "transitional" both caps will be studied for a good portion of the apparition.
Except for the effect of the terminator on the polar cap it will be in sunlight until opposition and because the Sub-Solar Point (Ds) will then begin to move northward, or more positive, with respect to the Sub-Earth Point or the Areocentric declination of Earth (De). After that the south pole will be in the shadow of the southern portion of the limb terminator.
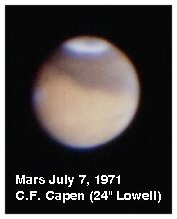
Figure 3-8. Photograph of Mars with south polar region tilted towards Earth and "Life Saver Effect" to center of south polar cap hood (211° Ls). Photo by C.F. Capen, Lowell Observatory 24-inch Clark, ID # 710707CI1142
MARTIAN SOUTH POLAR CAP
PERIPHERY
Upon emergence from beneath the polar hood, the SPC appears to have a rather smooth and uniform border. Later, during the rapid thaw period, the edge of the cap will appear uneven. Several bright, white projections will begin to detach from the SPC around this time (210° Ls) and a number of dark rifts in the SPC will become apparent. One of the first of these rifts should be the Magna Depressio (270° W, 80° S).
Near 215° Ls, a dark rift, Rima Australis should appear between 290° W and 350° W, connecting with Magna Depressio. Also, the SPC develops a bright projection from 010° W to 020° W in Argenteus Mons. From 220° Ls, a bright projection, Novissima Thyle, develops at 300° W to 330° W, and a dark rift, Rima Angusta, appears at 60° W to 300° W (See Figure 3-9).
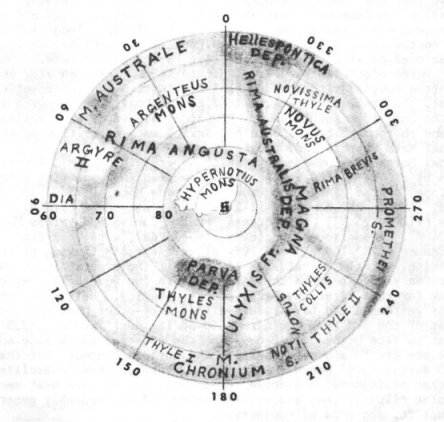
The Novissima Thyle is the famous recurrent cap remnant located south of Hellas, known as the " Mountains of Mitchel ," discovered in 1845 by O.M. Mitchel, at the Cincinnati Observatory, Ohio. Once Novissima Thyle becomes detached from the cap edge it is known as Novus Mons ("New Mountains") and will form two small white patches near the south polar cap edge. These will be particularly prominent during 213° - 221° Ls. Located near 300° -3 30° W and 75° S, this pair of brilliant white dots cab be detected with 8-inch apertures or smaller (See Figure 3-10).Figure 3-9. An orthographic south polar projection reference map of the Martian south polar feature locations and names. Drafted by C.F. Capen.
Around 180° Ls,the SPC will be rapidly shrinking, and its brilliant whiteness will contrast with its dark rifts, making the South Cap the most salient and beautiful feature on the Martian globe. Novus Mons to become detached from the cap edge during the period of 217° - 220° Ls and to disappear in sometime during the 250° - 260° Ls period. Also, by now the observer will recognize that the SPC is offset in latitude from the present rotational pole toward 35° - 40° E such that the pole does not fall within the residual ice deposit [ Zuber , 1998].Figure 3-10. Photograph of Mars with south polar region tilted towards Earth and "Mountains of Mitchel" to right of polar cap. Photo by C.F. Capen, Lowell Obs. 24-inch, ID # M880827R1307.
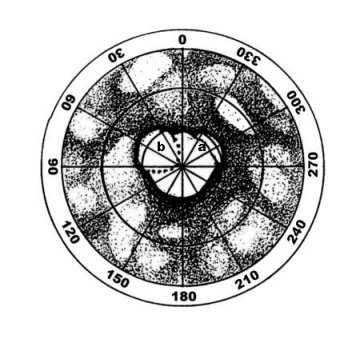
Figure 3-11. The Martian South Polar Region during early southern summer (270 – 280° Ls). Two large ice deposits make up the mail polar cap separated by a dark rift (a), Rima Australius, and a dotted line (b) that indicates the last remnant of the south polar cap in 1986 during southern mid-summer (320° - 340° Ls). The polar cap is offset in latitude from the true pole by several degrees in longitude in the direction of Areocentric longitude 35° to 45°.
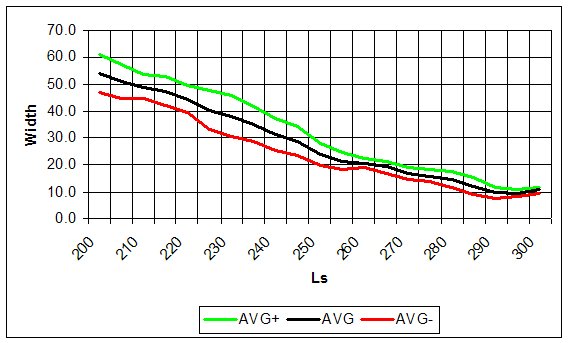
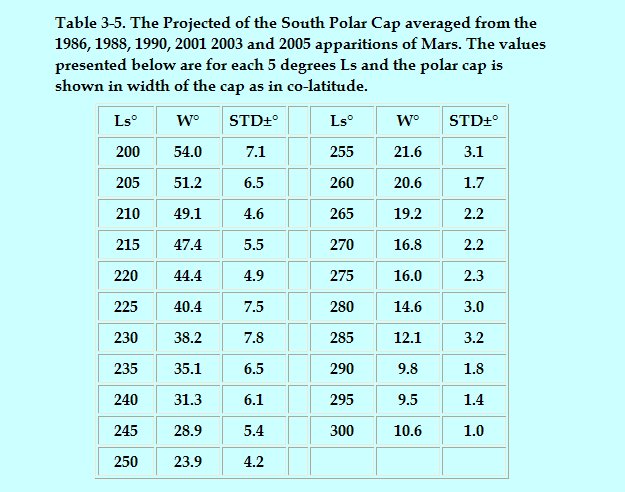
Figure 3-12. Retreat of the South Polar Cap (SPC) averaged from the 1986, 1988, 1990, 2001, 2003 and 2005 Perihelic apparitions of Mars. Black line represents the average width in degrees of the SPC. Green and red lines represent the standard deviation from the average. Ls is the longitude of the Sun.
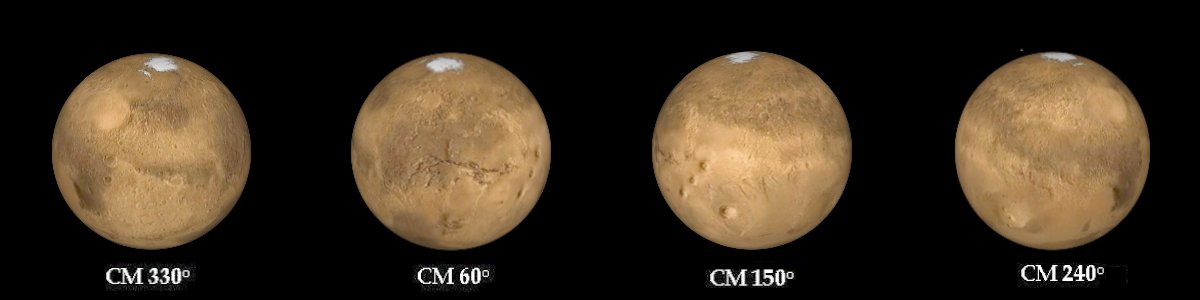
The south polar cap summer remnant is not centered on the polar axis but offset in latitude in the general direction of 35° to 40° longitude. If the central meridian (CM) is at 60° then the polar cap is fully visible and off set towards the observer. The polar cap can apparently disappear at times, especially when Mars is at 240° CM if any part of the terminator is present at the south pole of Mars. An excellent rendition of the SPC offset is documented on ("tukosz Sujko's web site") with this animation: https://cdn.astrobin.com/images/10412/2020/43f5a31e-da07-4fe4-a45a-3294b4598f71.gifTable 3-5. The Projected of the South Polar Cap averaged from the 1986, 1988, 1990, 2001 2003 and 2005 apparitions of Mars. The values presented below are for each 5 degrees Ls and the polar cap is shown in width of the cap as in co-latitude.
Figure 3-13 illustrates the position of the south pole when centered toward or away from the observer, and with to the extreme left or right of the 60° CM.
Planetary scientists have shown the white substance of the Martian polar caps is probably some form of crystallized water (H 2 O) or solidified volcanic carbon dioxide (CO 2 ). Space mission data sent back from Mars confirmed Earth-based observations of frozen water and carbon dioxide in the Martian polar caps. Sublimation of the H 2 O and CO 2 contributes to the Martian atmospheric clouds and hazes as the spring and summer cap-thaw becomes more rapid.
Many interesting cloud or ice-fog formations appear at the polar regions of Mars during late spring as the sub-solar point rises higher in the Martian latitudes. Since the atmospheric pressure is usually below the point that water can become liquid and temperatures are usually below the freezing point, especially in the polar regions, melting of the polar ice is not possible. The sublimation process is responsible for the water vapors we find in the Martian atmosphere that forms hazes and clouds.
The dark banding that can often be seen surrounding the polar caps during retreat is thought to be caused by formations of hoarfrost at the edge of the polar cap. This rough or textured material lowers the reflection of Sunlight from that area of the surface and could possibly darken the surface adjacent to the polar cap. Recently some observers referred to this dark band at the SPC as the so-called "Lowell Bands." This feature was first associated with the north polar region (NPR) of Mars; however, to a lesser extent this can be seen in the south polar region. Any suggestion that damp, melted water ice from the polar cap causes this phenomenon is unfounded. In addition, from the perspective of Earth-bound observers the brilliant reflection from the polar cap next to a darker surface material will cause a "contrast effect," as we observers refer to it. When very bright objects are placed next to duller, material we tend to see a band separating the two darker than it really is. Irradiation in the human eye is another cause for this phenomenon.
Both polar regions exhibit similar behavior during their respective early-spring periods. Often, each emerges from its winter darkness when its dull-gray hood begins to dissipate as spring progresses, then its brilliant polar cap peeks out and begins to retreat pole-ward. This is especially true for the Northern Polar Region (NPR), however, observers have noted that occasionally when the Southern Polar Region (SPR) reaches the end of its respective winter season it is often clear of its dull cloud/haze canopy. This has led astronomers to considerable debate over the SPR’s seasonal behavior.
Measure the Polar Caps of Mars
For many years the ALPO Mars Section has engaged in micrometer measurements of Mars to plot the retreat and reformation of the polar caps. The small apparent size of Mars renders micrometer measurement very difficult and laborious task amateur astronomers are not likely to enjoy. You might compare this type of observing to having a tooth filled without the benefit of Novocain. However, it is an important method for studying the behavior of Mars’ polar caps and their effect on the planet’s weather. Adding to this difficulty is the variable "astronomical seeing" that causes the apparent disk of Mars to blur or expand. Clouds and hazes at the Martian polar regions also hamper measurements, even using the recommended red filter techniques.
NOTE: The use of red filter when measuring the polar caps of Mars with a micrometer or from CCD images the use of red filters is necessary to penetrate clouds and haze covering the polar regions to define the true edge of the polar cap surface materials. Filters in shorter wavelengths tend to brighten aerosols and particulates in Mars’ atmosphere and hide the polar cap from out view.During the 1960’s and 1970’s experiments in measuring Martian polar caps from photographs were carried out by the ALPO Mars Section. A two degree (2°) systematic error in latitude was found by Charles F. ("Chick") Capen using this method even on photographs taken with a variety of large professional telescopes [ Capen , 1970]. Photographs taken during less than ideal "astronomical seeing" resulted in increased systematic errors. No empirical method has been found to correct these errors. Non-linear response of film restricts exposure times to the linear part of the film’s "characteristic curve" or film density / brightness curve in order to produce predictable results [ Dobbins et al , 1988]. This is before we began to use digital images to make polar cap measurements of [ Beish, 2000].
Furthermore, most of the photographs we received were too small to be used effectively. It is clear that obtaining photographs with a useable image scale too difficult for the average observer and unproductive for the observing program. The answer to our dilemma seems to be to increase image scale, while keeping the exposure time down, to produce images with a linear response. As hard as we tried to improve it, conventional photography had to be abandoned. So, we returned to using micrometers as our main polar cap measuring device.
Discussed in this article will be the two methods of using a Bi-Filar micrometer at the telescope and reduction of this data to a useable form. Then, a discussion of using digital images and image processing software to analyze these images and to refine the polar cap measurements that reduces systematic errors
The equations used to reduce these measurements are sensitive to image size and seeing conditions [ Beish , 1986]. Effects of atmospheric turbulent, unstable telescope conditions, and telescope drive errors might cause the photographs to blur or shift in position and cause erroneous measurements. This is an old and proven method of measuring the polar caps with a bi-filar micrometer at the telescope.
SUMMARY
From the early 1960’s ALPO observers measured Mars’ polar caps to understand what effect the polar regions has on the behavior of Mars’ atmosphere. While the author feels this tedious work is more suited for the professional observer, never the less the job is important enough to fascinate amateur planetary observers. Also, results could possibly help solve some of the mysteries of the Red Planet Mars.
Several methods were employed in measuring the latitudes Martian polar caps. Bi-filar micrometers and photograph plates were used. ALPO researchers found that micrometer measurements were more accurate and produced fewer systematic errors than by using photographs. However, the effects of human errors, equipment handling, and effects of weather on the observer limit even this method.
Compare the above with the CCD camera. One only has to find the image and obtain the desired focus on the computer monitor then settle down in a warm room. Wait until periods of good seeing -- then shoot. Of course, this is obviously not the whole story. The CCD camera is subject to electronic component noise, pixel defects, and other problems. Image processing programs can be used to take out noise or defects and enhance the images way beyond the dreams of the most planetary photographers. You still have the same telescope and seeing problems. Some of these problems can be taken care of with the proper techniques before and after the observing session begins, flat fields, etc., but that is a subject for a more technical discussion on CCD technology.
Our experience indicates that it takes
considerable time to do all this, and sometimes even more than
the other two methods discussed above. However, when one
considers we can produce larger images in a shorter amount of
time, and measurements can be done in the comfort of the
laboratory instead of the observatory, is becomes obvious that
CCD technology offers advantages over other methods discussed
herein. Now, measuring the Planet Mars for science can be
fun!
REFERENCES
Beish, J.D., D.C. Parker, and C.F. Capen, (1982), "Recovery of Rima Tenuis in the Martian North polar Cap," Announcement of the rediscovery of the Rima Tenuis in December, 1981, by J.D. Beish, D.C. Parker, and C.F. Capen. International Astronomical Union Telegram (CBAT) : Smithsonian Astrophysical Observatory; No. 3659, Jan 19
Beish, J.D., D.C. Parker, and C.F. Capen, "Calculating Martian Polar Cap Latitudes, (1986), " Journal of the Association of Lunar and Planetary Observers (J.A.L.P.O.) , Vol. 31, No. 7-8, April.
Beish, J.D., (2000), "Measuring
Celestial Dimensions with Micrometers," January.
http://www.m2c3.com/alpocs/Library/Articles/micrometers/micrometer.htm
Beish, J.D., (2000), "Systematic Errors in Micrometer Measurements using Different Methods for Finding Polar Cap Latitudes of Mars," August. http://www.lpl.arizona.edu/~rhill/alpo/marstuff/articles/MICRO1.HTM
Capen, C.F, and Capen, V.W., (1970), "Martian North Polar Cap, 1962 - 68," Icarus , 13, No. 1, July, 100-108.
Capen, C.F. and Cave, T.R., (1971), "Mars 1969 - The North Polar Region - A.L.P.O. Report II", Journal of the Association of Lunar and Planetary Observers (J.A.L.P.O.), Vol. 23, Nos. 3-4, (Aug 1971) and Vol. 23, Nos. 5-6.
Capen, C.F., D.C. Parker, and J.D. Beish, (1980), "Return of the Martian Rima Tenuis," Naming discoverers C.F. Capen, D.C. Parker, and J.D. Beish, Bulletin of the American Astronomical Society , Vol. 12, No. 3.
Dollfus, Audouin, (1973), “New optical measurements of planetary diameters IV. Size of the north polar cap of Mars,” Icarus 18, 142.
Dobbins, T. A., D.C. Parker, and C.F. Capen, (1981), Introduction to Observing and Photographing the Solar System , Willmann-Bell, 1988, 145 - 147.
Ingersoll, Andy and Shane Byrne (2003), “The Martian polar caps are almost entirely water ice, Caltech research shows,“ Caltech Media Press Release, PR12342, http://pr.caltech.edu/media/Press_Releases/PR12342.html
Jamison, Eric (2007), “Polar hood clouds; Mars Nomenclature,” The Mars Opposition of 2007, http://ejamison.net/mars_nomenclature.html
Kieffer, H.H., B. M. Jakosky, C.W. Snyder, and M.S. Matthews, Editors (1992), Chapter 9, "Long-Term Orbital and Spin Dynamics," Mars , University of Arizona Press, pp.304-305
Martin, L.J. and P.B. James 1984. Mars 1984: the transition from polar hood to surface cap. Bull. Am. Astron. Soc. 16, (No. 3, Part I), 673.
Michaux, C.M. and Newburn, R.L.,( 1972). "Mars Scientific Model", JPL Document No. 606-1 , “Seasonal Activity,” Section 4.2, p.3.
Minami, M., (1993), "The Recession of the North Polar Cap," Communications in Mars Observations, OAA Mars Section, No. 138, 25 October, p1300.
Minami, M., (1993), "Tendency of the NPC Recession in 1992/93," Communications in Mars Observations, OAA Mars Section , No. 139, 25 November.
Miyamoto, S., (1971), “Observed Seasonal Change of the Southern Martian Polar Cap,” Astronomy and Space, 227-231.
Miyamoto, S., (1972), “Life Cycle of Martian Polar Cap, Sand Storm and General Circulation,” Contrib. Kwasan Hida Obsevatories, 207, 73-75.
Miyamoto, S., (1974), “Seasonal Change of the Martian Polar Caps,” Contrib. Kwasan Hida Obsevatories , 218, 1-8.
Parker, D.C., Capen, C.F., and Beish, J.D., "Exploring the Martian Arctic," Sky and Telescope, Vol. 65, No. 3, pp. 218-220, March 1983.
Parker, D.C., Beish, J.D., and Capen, C.F., "The Third Martian Arctic Expedition" Proceedings, 38th. National Convention of the Astronomical League, pp. 79-81, August 1984.
Peek, B.M., (1981), The Planet Jupiter: The Observer’s Handbook, Rev. ed, London; Faber and Faber Limited, ISBN 0-571-18026-4.
Pickering, W.H., 1925, “Report on the Mars No. 31,” Popular Astronomy, 23, 576.
Rayl, A.J.S., (2003), “Researchers
Find Mars’ South Pole Cap is Mostly Water Ice,” Planetary
Society News,
http://www.planetary.org/html/news/articlearchive/headlines/2003/mars_s-pole_water-ice.html
Slipher, E. C., 1962, Mars, the photographic story : Cambridge, Mass., Sky Publishing Corp., and Flagstaff, Ariz., Northland Press, 168 p. 1, 1972
Titus et al., (2003), "Exposed Water Ice Discovered near the South Pole of Mars," Science, 299: 1048-1051
Venable, Roger and Jim Melka, “First Detections of the North Polar Cap of Mars in 2007: A Continuing Conundrum,” The Strolling Astronomer, Vol. 50, No. 4, pp. 29 – 36: (http://www.alpo-astronomy.org/djalpo/50-4/JALPO50-4.pdf)
Zuber, M. T. , (1998), “STRUCTURE OF THE
MARTIAN POLAR DEPOSITS”, Department of Earth, Atmospheric and
Planetary Sciences, Massachusetts Institute of Technology,
Cambridge, MA 02139-4307. http://mars.jpl.nasa.gov/mgs/sci/fifthconf99/6229.pdf