The brilliant white polar caps of Mars are among the planet’s most prominent and intriguing features. Because the Martian polar caps are affected by the planet’s 25.2° axial tilt. They are observed to thaw and re-accumulate in an annual seasonal cycle. Indeed, many of the observed surface changes and atmospheric phenomena appear to be directly coupled to the seasonal climate which causes the spring thawing phase of one polar cap as autumn allows the reformation phase of the opposite cap.
Planetary scientists have shown the white substance of the Martian polar caps is probably some form of crystallized water (H2O) or solidified volcanic carbon dioxide (CO2). Space mission data sent back from Mars confirmed Earth-based observations of frozen water and carbon dioxide in the Martian polar caps. Sublimation of the H2O and CO2 contributes to the Martian atmospheric clouds and hazes as the spring and summer cap-thaw becomes more rapid.
Many interesting cloud or ice-fog formations appear at the polar regions of Mars during late spring as the sub-solar point rises higher in the Martian latitudes. Since the atmospheric pressure is usually below the point that water can become liquid and temperatures are usually below the freezing point, especially in the polar regions, melting of the polar ice is not possible. The sublimation process is responsible for the water vapors we find in the Martian atmosphere that forms hazes and clouds.
The dark banding, the so-called "Lowell Bands," that can often be seen surrounding the polar caps during retreat is thought to be caused by formations of hoarfrost at the edge of the polar cap. This rough or textured material lowers the reflection of Sunlight from that area of the surface and could possibly darken the surface adjacent to the polar cap. Any suggestion that damp, melted water ice from the polar cap causes this phenomenon is unfounded. In addition, from the perspective of Earth-bound observers the brilliant reflection from the polar cap next to a darker surface material will cause a "contrast effect," as we observers refer to it. When very bright objects are placed next to duller, material we tend to see a band separating the two darker than it really is. Irradiation in the human eye is another cause for this phenomenon (See Figure 1).
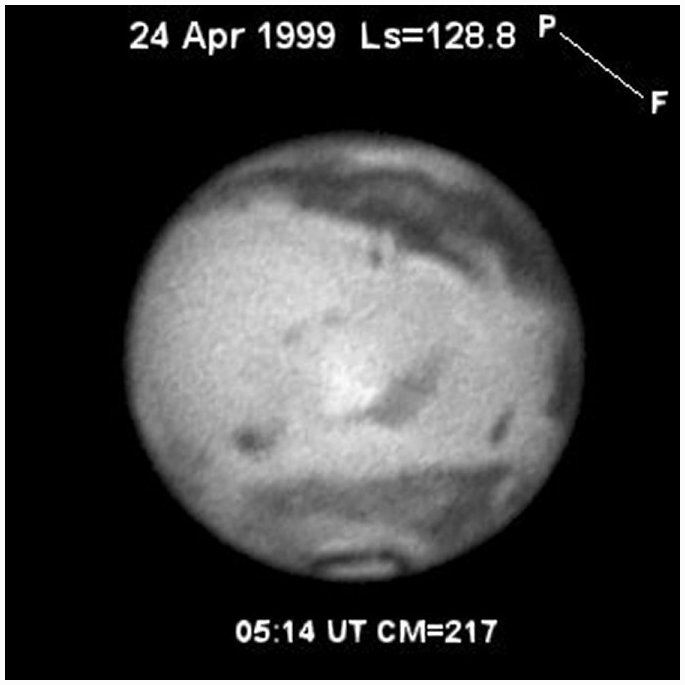
Figure 1. CCD image of Mars during northern summer with NPC remnants or projections Lemuria (196° - 227° long) and Cecropia (278° - 311° long). CCD image by Don Parker using 41-cm Newtonian.
A study of the history of the Martian NPC from
measurements made from 1882 through 1903, 1962 through 1969,
1970 through 1978 ,and 1980 through 1984 reveals that the NPC
appears to have been larger than average during the 1960’s
and then slightly smaller than average during the present
decade. This paper shows that at least the 1960’s NPC was
larger, on the average, than the NPC during the 1980’s
[Parker et al, 1983]. This study of the
NPC is still in progress using the three volumes of the
Annals of Lowell Observatory: 1894, various
Lowell Observatory Bulletins with NPC
measurements during the 1901 – 1905 apparitions of Mars, and
many other sources meticulously collected and archived by Chick
Capen. Measurement before 1962 were taken from drawings
and were not included in the statistical averaging used for the
plot in Figure 2. The results will be added herein in
good time.
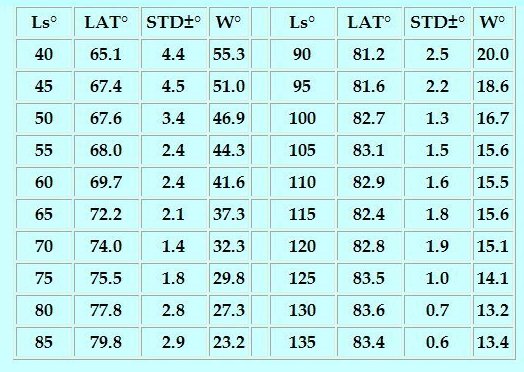
The Martian North Polar Cap (NPC) spring and summer regression curves have been average from latitude measurements taken during apparitions from 1980 (Capen, Parker & Beish), 1982 (Parker & Beish), 1984 (Parker & Beish), 1993 (Parker & Beish), 1997 (Parker & Beish), 1999 (Parker & Beish) and 2003 (Parker & Beish). The resulting average north polar cap latitudes and widths with respect to the Ls are presented in Table 1. The Areographic latitude of the eastern and western edges of the NPC are given as the vertical scale of the graph and the Areographic longitude of the Sun (Ls) appears at the bottom of the graph for the indicated seasonal periods observed.
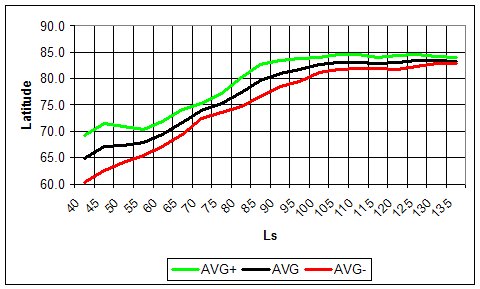
Figure 2. . Retreat of the North Polar Cap averaged from the 1980 through the 2003 apparitions of Mars. Green and red lines represent the standard deviation from the average. Ls is the longitude of the Sun. The curves represent the average latitudes for each 5 degrees in Ls.
Table 1. The Projected of the North Polar Cap averaged from the 1980 through the 2003 apparitions of Mars. The values presented below the average latitudes (LAT) for each 5 degrees in Ls and the polar cap is shown in width (W) of the cap as in co-latitude.
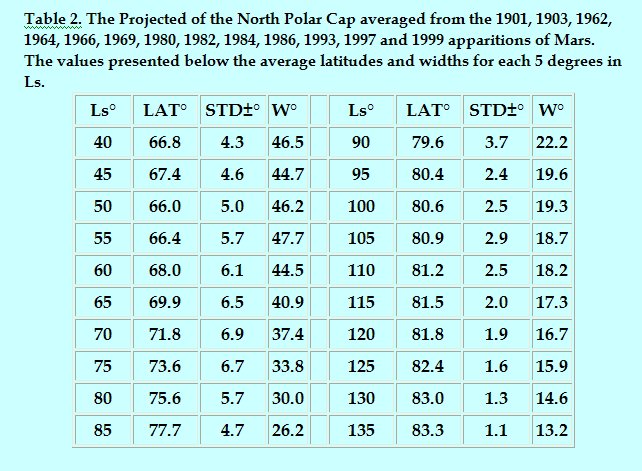
The following represents the north polar cap measurements during the apparitions: 1901 (Antoniadi), 1903 (Antoniadi), 1962 (Capen), 1964 (Capen), 1966 (Capen), 1969 (Capen & Cave), 1980 (Capen, Parker & Beish), 1982 (Parker & Beishh), 1984 (Parker & Beish), 1993 (Parker & Beish), 1997 (Parker & Beish) and 1999 (Parker & Beish).
From the plot and table below one can see a substantial difference between the results Figure 2 and Table 1 and these in Figure 3 and Table 2, especially the Standard Deviations (STD). From the historical records we find that substantial differences may result from the systematic errors associated with the type equipment and the individual observers used in the measurements. It is not clear that these differences are as result of natural processes or observer errors; so we will only use these measurements as a reference and are not to be used to predict the behavior of the north polar cap of Mars as presented in this paper.
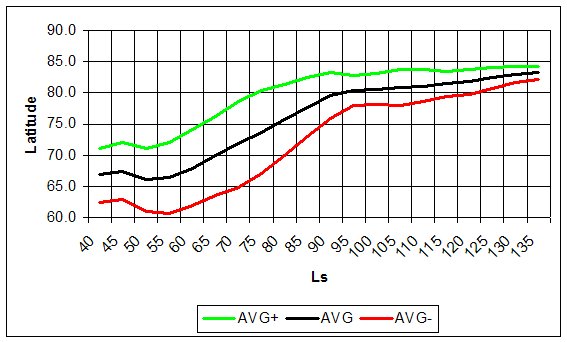
Figure 3. Retreat of the North Polar Cap averaged from the 1901, 1903, 1962, 1964, 1966, 1969, 1980, 1982, 1984, 1986, 1993, 1997 and 1999 apparitions of Mars. Green and red lines represent the standard deviation from the average. Ls is the longitude of the Sun. The curves represent the average latitudes for each degree in Ls.
Observers have long noted that Mars’ meteorology follows the behavior of the NPC: as the summer cap shrinks there is an increase in cloud activity, especially in the orographic water-ice clouds which form over the volcanoes during the Martian summer afternoons. Viking data has verified water vapor movement from the North Pole to the planet’s equator during this season. . In some Martian years, however, the appearance of these clouds is occasionally delayed as much as a Martian month, corresponding to the delay in NPC regression.
Peripheral Aspects
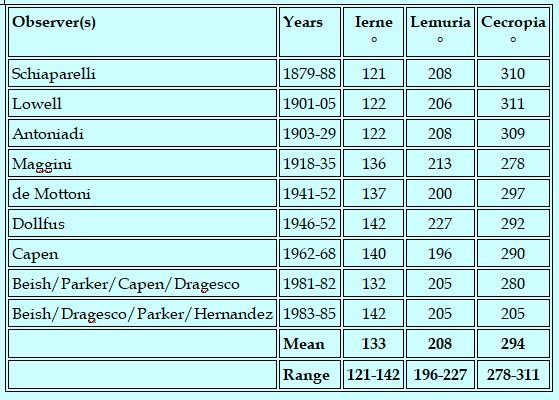
Upon emergence from beneath the polar hood, the NPC appears to have a rather smooth and uniform border. Later, during the rapid thaw period, the edge of the cap will appear uneven. C.F. Capen, using the 82-inch reflector at the McDonald Observatory in Texas, wrote "observing with the large telescope with high resolution revealed a polar cap with an uneven and jagged edge with numerous small, white, circular detachments along the dark peripheral band as the cap rapidly retreated poleward during Martian spring." By Martian summer, the NPC retreat slows and three bright projections appear on the edge of the cap. These areas detach from the NPC as the cap retreats past the 80° latitude and remain throughout the summer and autumn. The white remnants are named after the areas on Mars that they occupy. Their averaged center-of-area Areographic longitude positions according to G. de Mottini’s 1941-52 IAU Mars map are as follows: Ierne 137° , Lemuria (Olympia) 200° , and Cecropia 297° . Table III compares these areas observed by various Mars observers from 1879 to 1984. (Refer to North Polar Map in Figure 3).

Figure 4. Drawing of Mars’ North Polar Cap area during early northern summer. Notice the dark rift, Rima Tenuis crossing the cap from 140° – 330° longitudes. The summer "projections" or remnants are beginning to emerge from the edge of the polar cap. Projection (a) Ierne, (b) Lemuria, and (c) Cecropia. Drawn by Jeff Beish.
Two other white patches were observed that are
not previously named as classical NPC remnants. They were noted
at the following aerographic locations: 1) latitude +81° and
longitude 3°, and 2) latitude +82° and longitude
59°.
Table 3. NPC Residuals lists observers and dates the projections were observed.
Observing these remnants can be most challenging, even when using large telescopes. With high magnifications and apertures of 10 inches or more, these features usually become apparent soon after the Martian summer solstice (90° ). The authors regularly employ magnifications of 450x to 1000x for studying the Martian arctic.
NORTH POLAR HOOD
Popular literature and papers published in The Strolling Astronomer, (J.A.L.P.O.) on Mars’ polar regions usually mention the dense polar canopy or "hood" that appears in late northern winter and early spring. However, past astronomers Clyde Tombaugh (discoverer of Pluto) and Leonard Martin (Lowell) discussed the possibility that the north polar cap does not form on the surface until the polar hood begins to dissipate. We know that the polar cap we see in summer is a layer of water-ice and we refer to this cap region as the "summer remnant." The latitude of the southern edge of the summer remnant or water ice cap is usually around 79 degrees by mid-summer.
The 1982 regression rate closely paralleled that of 1980, but in 1984, a number of unusual events were observed. After a relatively normal initial thaw, the cap abruptly stopped receding during late Martian spring (70° Ls) and began to re-condense [Capen et al, 1971 and Parker et al, 1984]. This is not abnormal and often occurs when Mars is near aphelion. The phenomenon has been termed the "Aphelic Chill" by Professor Clyde Tombaugh and seems to be caused by arctic hazes blocking the feeble sunlight before it can reach the cap [Parker et al, 1983].
The A.L.P.O. Mars Section gave passing thought to this hypothesis and decided to attempt to watch for any sighs of this beginning in early 1992. By then Mars Recorder Don Parker was well on his way to perfecting his CCD imaging techniques when he slipped up once and forgot to install a special Infrared Radiation blocking filter in his optical train and took some remarkable images of Mars.
In the 1992 apparition of Mars, observers reported that the North Polar Hood (NPH) was bright and large for most of this apparition until late November 1992 (2° Ls). At that time, we started to see the NPH slowly break up. When the NPC appeared it was brilliant and mostly clear afterward with a very dark collar around it. The NPC appeared, at times, to be "peanut" shaped with notches in the collar. As the NPH started to thin out in December, we got views of some of Mars’ far northern dark marking.
When we looked at the images Parker had taken on October 25, 1992 (346° Ls) we noticed dark markings mixed in with the bright polar hood. After some years now and hours processing these images, we have discovered that the dark markings correspond with well-charted surface albedo features the images regions of Mars. While it is only speculation we feel that theses markings are real surface features that has leaked through on the tri-color CCD images the polar hood and may be evidence that surface deposits of ice or frost actually does not exit during that seasonal period. The period corresponds to the well observed “polar hood” phenomena and if true adds credibility to the Tombaugh-Martin theory (See Figure 5).
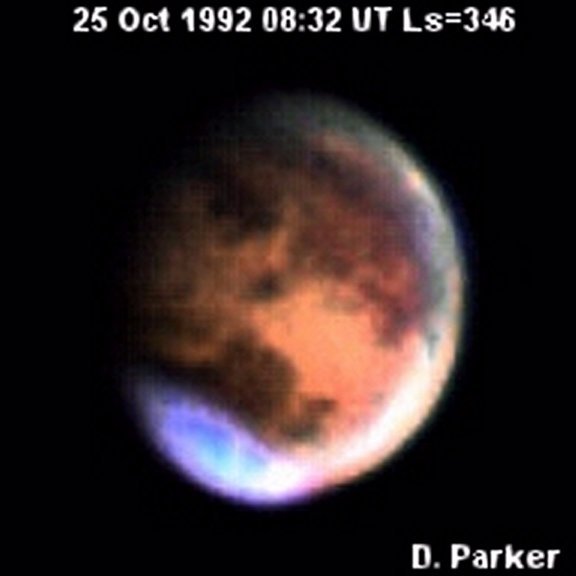
Figure 5. CCD image of Mars during late northern winter indicating presence of polar hood and surface albedo features leaking through the green and blue filters. CCD image by Don Parker using 41-cm Newtonian. South edge of polar hood 49.5° latitude and northern albedo area 69.7° latitude.
Prior to the use of CCD technology we relied on either visual observations or film images of he polar regions and even using deep red filter we were unable to see though the hood to see the polar cap surface materials. Now, using infrared sensitivity of cameras with CCD chips we are now able to penetrate through the haze canopy, the polar hood, and see the actual polar cap.
A recent article on the 2007 NPC (3.67-Mb PDF file, go to page 31) reveals an important analysis on the detection of the north polar cap [Venable, 2008].
REFERENCES
Capen, C.F. and Cave, T.R., (1971), "Mars 1969 - The North Polar Region - A.L.P.O. Report II", Journal of the Association of Lunar and Planetary Observers (J.A.L.P.O.), Vol. 23, Nos. 3-4, (Aug 1971) and Vol. 23, Nos. 5-6.
Jamison, Eric (2007), “Polar hood clouds; Mars Nomenclature,” The Mars Opposition of 2007, http://members.leapmail.net/~ericj/mars_nomenclature.html
Martin, L.J. and P.B. James 1984. Mars 1984: the transition from polar hood to surface cap. Bull. Am. Astron. Soc. 16, (No. 3, Part I), 673.
Michaux, C.M. and Newburn, R.L.,( 1972). "Mars Scientific Model", JPL Document No. 606-1, “Seasonal Activity,” Section 4.2, p.3.
Parker, D.C., C.F. Capen, and J.D. Beish (1983). "Exploring the Martian Arctic." Sky and Telescope, Vol 65, No. 3, pp. 218-220. March.
Parker, D.C., Beish, J.D., and Capen, C.F., "The Third Martian Arctic Expedition" Proceedings, 38th. National Convention of the Astronomical League, pp. 79-81, August 1984.
Slipher, E. C., 1962, Mars, the photographic story: Cambridge, Mass., Sky
Publishing Corp., and Flagstaff, Ariz., Northland Press, 168
p.
1, 1972
Venable, Roger and Jim Melka, “First
Detections of the North Polar Cap of Mars in 2007: A Continuing
Conundrum,” The Strolling Astronomer, Vol. 50, No. 4, pp. 31 –
36: (https://alpo-astronomy.org/djalpo/50-4/JALPO50-4.pdf)